When to use it
- Reporting the results of a test, trial or evaluation to a manager or a client
- Investigating a failure or a recurring problem and recommending a fix
- Engineering, science and computing assignments that ask for a technical report
- A numbered report in a department's or a lab's technical report series
- A feasibility study or a comparison of options before a purchase or a design decision
A technical report is a document that presents the purpose, method, results and conclusions of a piece of technical work, such as a test, an investigation or an evaluation, for readers who have to act on it. Most technical reports share one format: a title page and a summary, then an introduction, the method, results, discussion, conclusions and recommendations, then references and appendices. A complete sample report comes first below. If your organization or your course sets its own report format, follow that, and use this page for the order and the detail each section needs.
The format assumes readers stop early. A manager may read only the summary, an engineer reads as far as the results, and often only the person repeating the work opens the appendices. Like the inverted pyramid of a news story, the report puts the answer first and the supporting detail after it.
Technical report example
Here is the template filled in for an invented frozen-food distributor whose handheld scanners kept shutting down in its freezer. The report is shortened, but every section is there. The company, the scanners and every figure are invented for illustration.
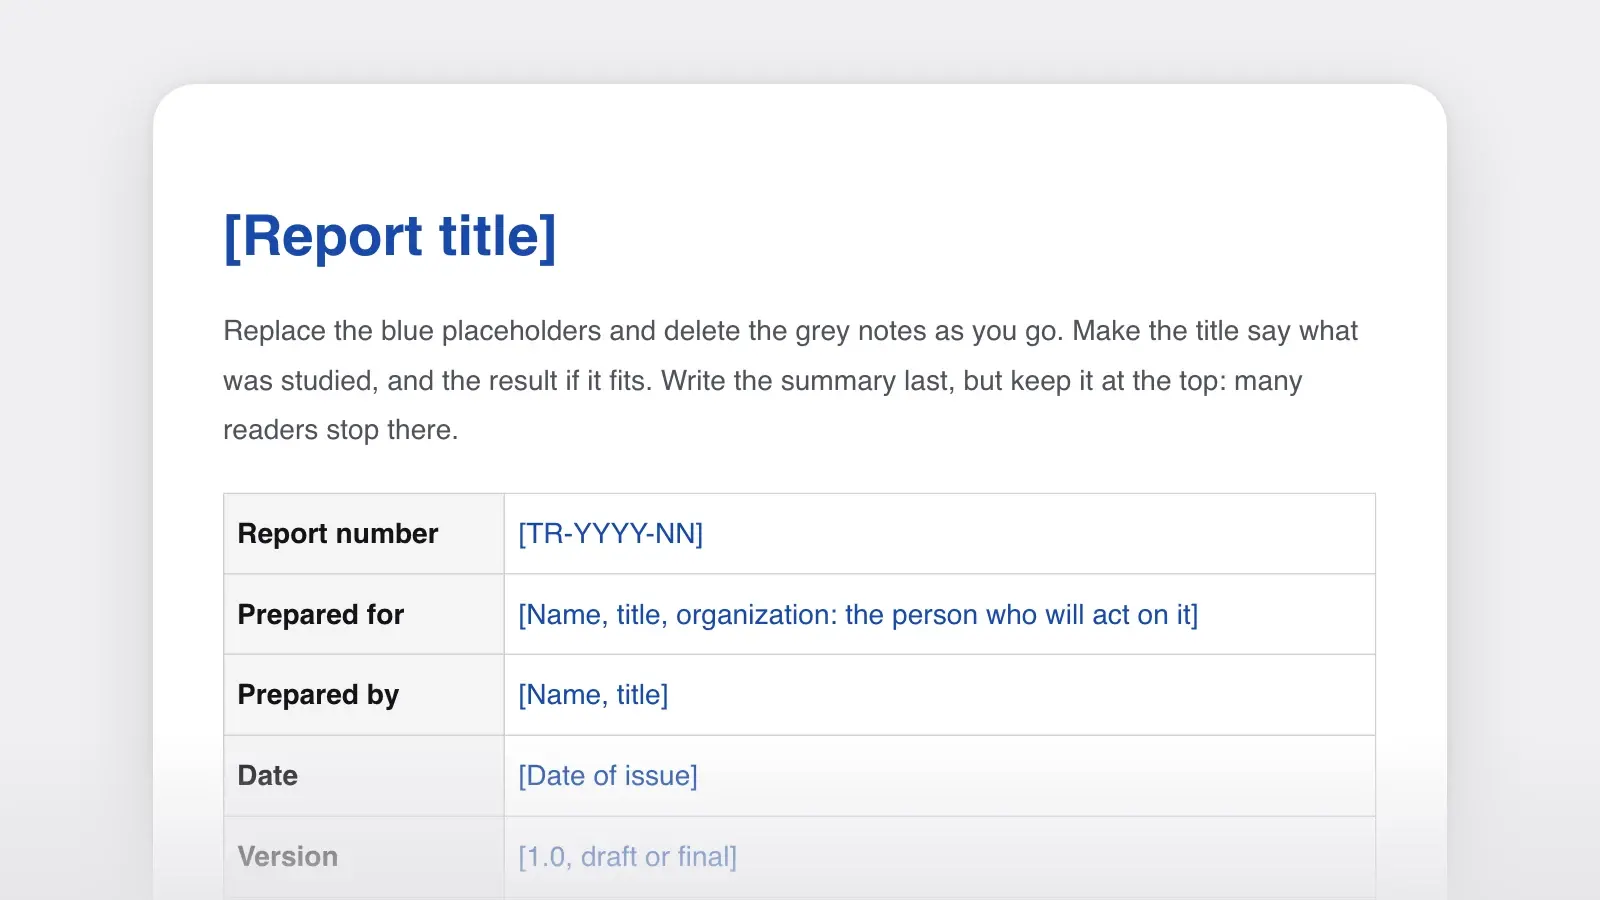
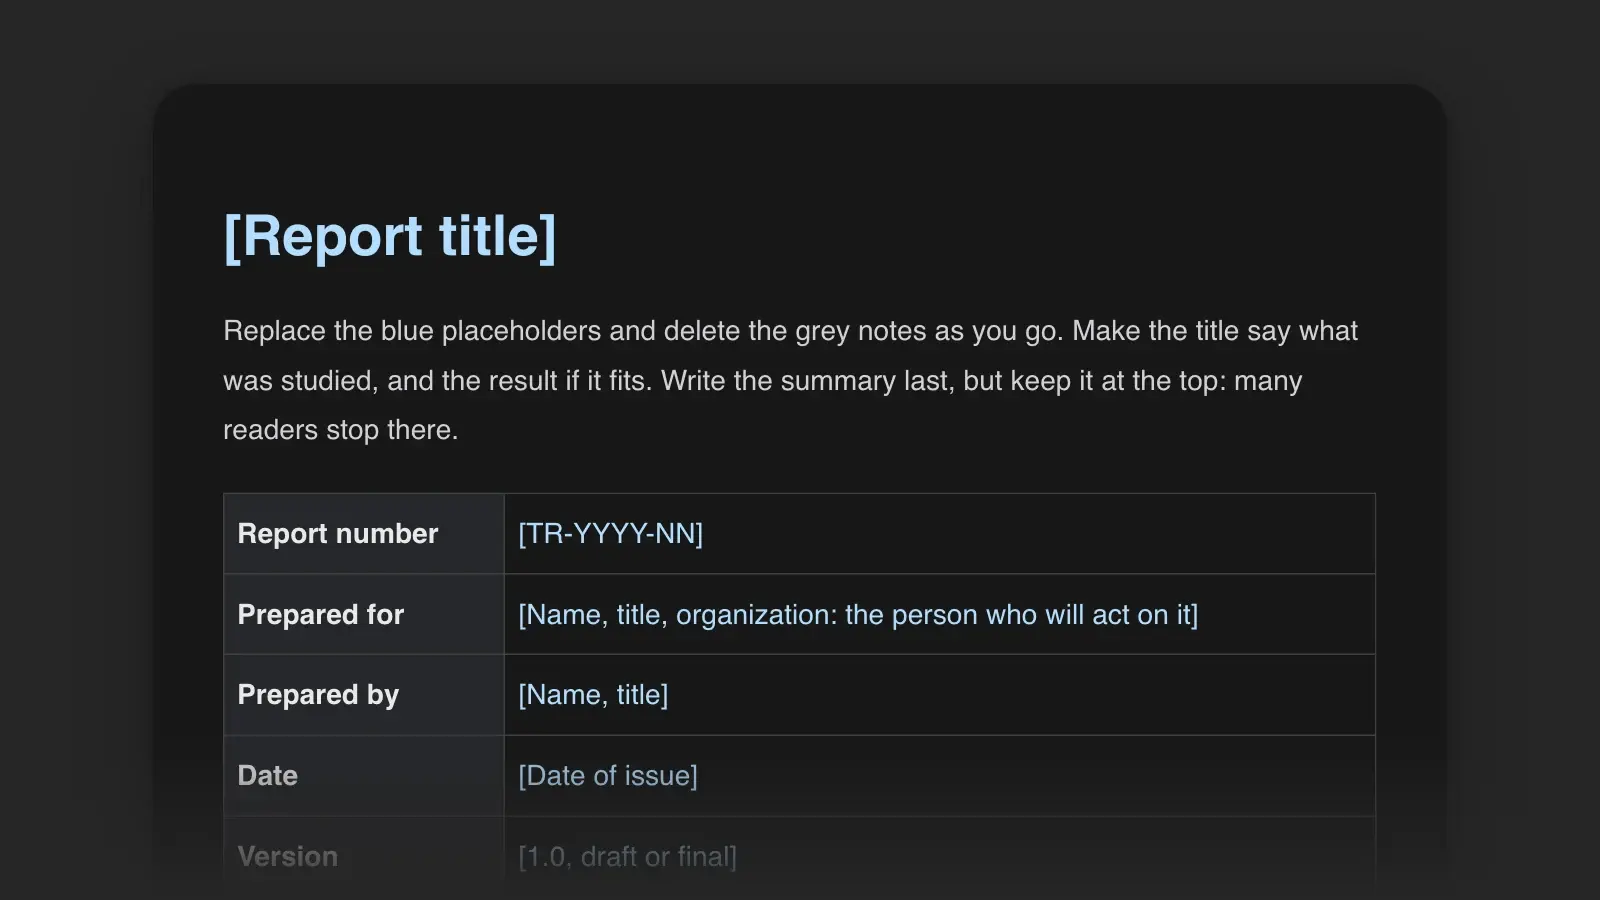
Title page. Report TR-2026-11 · Handheld scanner battery life in the Dock 4 freezer: test results and recommendations · Prepared for Grace Mensah, operations manager · Prepared by Owen Pike, operations engineer · Kestrel Frozen Foods, Riverside distribution center · 3 November 2026 · Version 1.0 · Distribution: shift leads, IT asset team
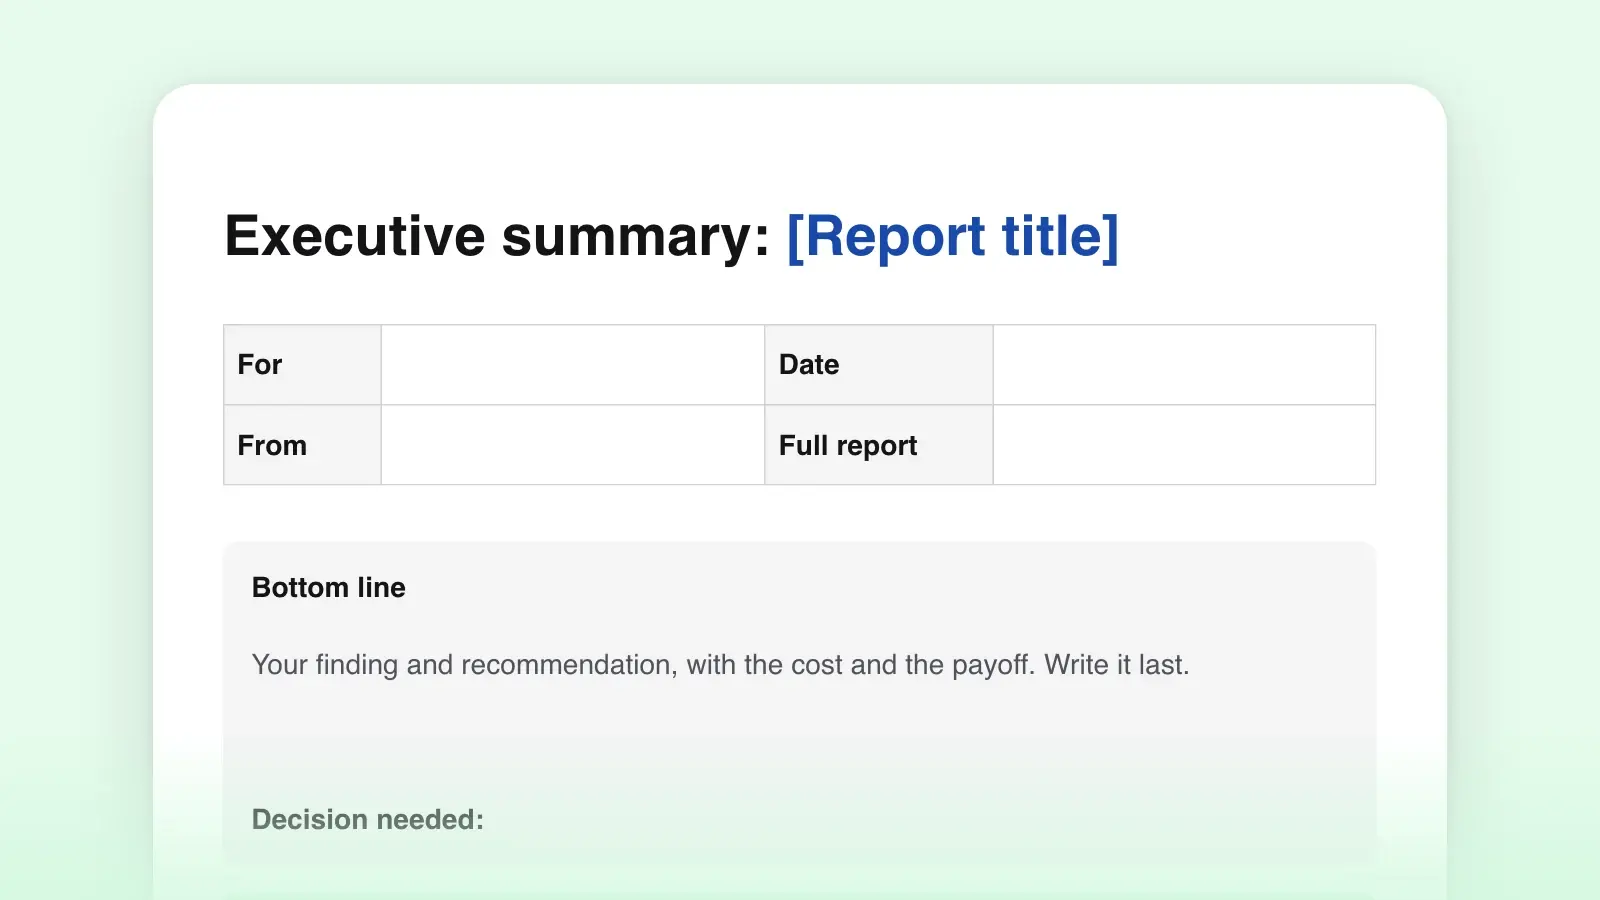
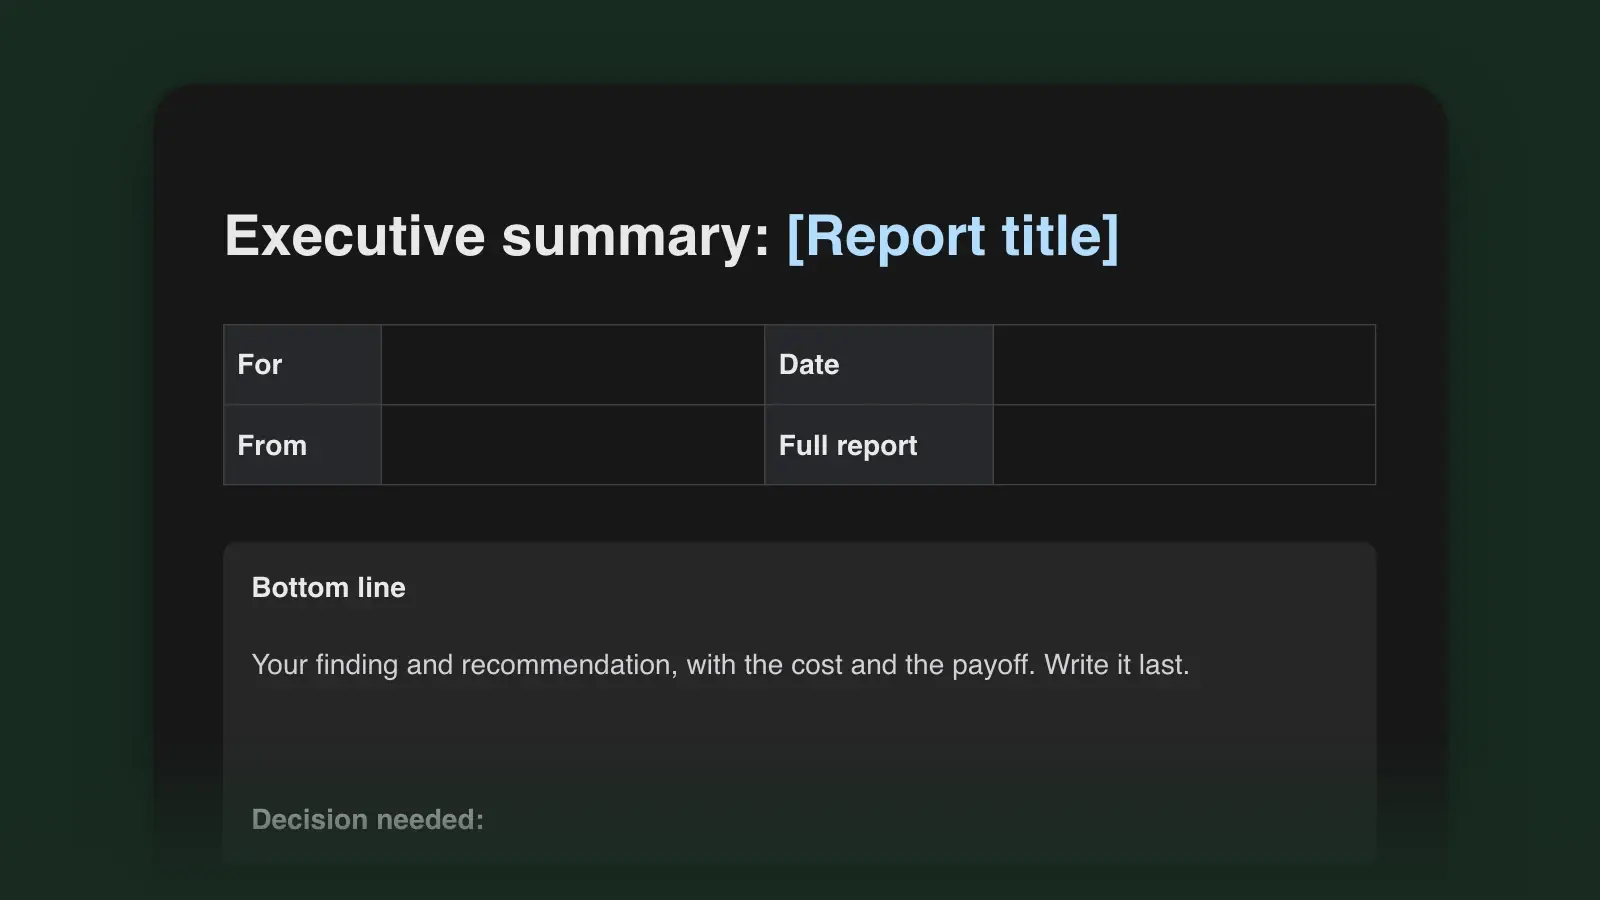
Summary. We recommend buying 30 spare batteries ($1,950), adding one battery swap at lunch to the freezer procedure and moving the chargers into the heated vestibule. In the Dock 4 freezer (−23 °C, one scan every 20 seconds, new batteries), a fully charged K-40 scanner lasted a median 4.1 hours, against 11.6 hours at room temperature (21 °C), so no battery lasted an 8-hour shift. Warming the scanners during breaks raised the median to 5.6 hours, and insulated holsters to 4.9 hours; warming breaks plus a swap at lunch kept all 30 test runs going to the end of the shift. We tested 30 scanners over five days after pickers reported shutdowns mid-shift.
1 Introduction. Between 1 September and 31 October, the help desk logged 37 tickets for scanners shutting down in the freezer, against two for the rest of the warehouse. Each shutdown sends a picker to the office for a charged scanner. This test measured battery life in freezer conditions and compared three ways to extend it. It covers the K-40 handheld scanners only, not the forklift terminals.
2 Method. Each run used one K-40 with a new battery charged to 100% at room temperature, running a script that scans once every 20 seconds. Five conditions, six scanners each per day, for five days, gave 30 runs per condition: A, room temperature (21 °C); B, freezer, continuous use; C, freezer, with the scanner warmed in the 12 °C vestibule during each 15-minute break, every 2 hours; D, freezer, in an insulated holster between scans; E, as C, with a battery swap at the 4-hour lunch break. The device-management system logged each shutdown. Scanners rotated between conditions each day.
3 Results. Table 1, runtime from a full charge:
- A, room temperature (21 °C): median 11.6 hours, shortest 10.9 hours; 30 of 30 runs lasted 8 hours
- B, freezer (−23 °C): median 4.1 hours, shortest 3.6 hours; 0 of 30
- C, freezer, warmed at breaks: median 5.6 hours, shortest 4.8 hours; 0 of 30
- D, freezer, insulated holster: median 4.9 hours, shortest 4.2 hours; 0 of 30
- E, as C, swap at lunch: no shutdowns; 30 of 30 lasted 8 hours, lowest charge at end of shift 14%
4 Discussion. Cold cut runtime by about two-thirds. Warming helped because a battery recovers some capacity as it warms; the holster helped less because pickers hold the scanner for most of each pick. The test can't establish three things: how the fleet's batteries behave, since every run used a new one and the fleet's are 2.5 years old on average; how real picking, with uneven scanning and idle spells, changes the drain; and whether the results hold at other docks or for other scanner models. Because of the first, the real runtimes are probably lower than these.
5 Conclusions. (1) In the freezer, no K-40 battery lasted a full shift without a swap under any tested condition. (2) Warming breaks plus one swap at lunch kept every run going to the end of the shift. (3) Insulated holsters alone are not worth buying for this problem.
6 Recommendations.
- Buy 30 spare batteries at $65 each ($1,950), one per freezer scanner. Owner: IT asset team, by 20 November.
- Add a battery swap at lunch to the freezer picking procedure. Owner: shift leads, by 1 December.
- Move the chargers into the heated vestibule; the battery's specification sheet allows charging only between 0 °C and 40 °C. Owner: facilities.
- Repeat conditions B and E in February with batteries older than two years.
References and appendices. K-40 battery specification sheet, revision C. Appendix A: all 150 runtimes. Appendix B: the scan script. Appendix C: help desk tickets, September–October 2026.
Why it works. The summary opens with the recommendation and its cost, then the main measurement with the conditions beside it, so a reader who stops after two sentences can still decide. The method is specific enough to repeat. Results are reported without comment, in one unit throughout, and the discussion says what the test can't establish and which way the main limitation (new batteries) bends the figures. Every recommendation traces back to a conclusion and names an owner.
How to use this template
- Name the reader and the decision
Write who the report is for on the title page, and the decision it supports in the first line of the summary. An operations manager deciding whether to buy spare batteries needs different detail from the engineer who will repeat the test.
- Record the method on the day
Note equipment, settings, dates, sample sizes and anything that went differently from the plan while you do the work. A method reconstructed weeks later is hard to check.
- Keep results, discussion and conclusions apart
Results report what you measured, with units. The discussion says what the numbers mean and where they could mislead. Conclusions state what is now known; recommendations say what to do about it. When interpretation creeps into the results, move it down a section.
- Write the summary last, and put it first
In about half a page, lead with the recommendation or the main conclusion, then give the main findings with their numbers and the conditions they were measured under, and the purpose in a sentence. Many readers stop there, so it has to make sense on its own.
- Number sections, tables and figures
Use 1, 1.1 and 1.2 for sections, number and title every table and figure, and mention each one in the text before it appears. Give the report itself a number, so anyone can point to “TR-2026-11, section 3”. Raw data and long calculations go in appendices.
Technical report format
A technical report has three parts: front matter that tells readers what they are holding, the body, and back matter for anything they may need to check. This is the order the template uses.
| Part | Section | What it holds |
|---|---|---|
| PartFront matter | SectionTitle page | What it holdsReport number, title, who it was prepared for and by, date, version, distribution |
| PartFront matter | SectionSummary | What it holdsPurpose, main findings with numbers, conclusion and recommendation |
| PartFront matter | SectionContents | What it holdsNumbered sections and appendices; lists of tables and figures in long reports |
| PartBody | Section1 Introduction | What it holdsBackground, the purpose of the work and its scope |
| PartBody | Section2 Method | What it holdsEquipment, materials, conditions and procedure, in enough detail to repeat |
| PartBody | Section3 Results | What it holdsWhat was measured or found, in numbered tables and figures, with units |
| PartBody | Section4 Discussion | What it holdsWhat the results mean, how certain they are and what limits them |
| PartBody | Section5 Conclusions | What it holdsWhat is now known, in a few numbered statements |
| PartBody | Section6 Recommendations | What it holdsNumbered actions, with owners and costs where you know them |
| PartBack matter | SectionReferences | What it holdsEvery source cited, in one citation style |
| PartBack matter | SectionAppendices | What it holdsRaw data, calculations, test scripts, drawings |
In the US, NISO's standard for this kind of document is ANSI/NISO Z39.18-2005 (R2010), Scientific and Technical Reports – Preparation, Presentation, and Preservation; as of November 2026, that 2005 edition, reaffirmed in 2010, is the one NISO lists. NISO describes it as outlining “the elements, organization and design of scientific and technical reports,” with guidance on front matter, text, tables and figures, and back matter. If your organization or your course has its own guidelines, follow those first.
Reports in a research series often open with an abstract instead of a summary. An abstract helps someone decide whether to read the report. A summary, often called an executive summary, gives a decision-maker the findings and the recommendation so they can act without reading on. If you need an abstract, see how to write an abstract.
Technical report samples by type
The scanner report is a test report. Other kinds keep the same frame and change the middle:
| Type | Answers | What changes | Sample title |
|---|---|---|---|
| TypeTest or evaluation report | AnswersDoes it meet the requirement? | What changesAcceptance criteria come before the method; results are compared with them | Sample titleLoad test of the checkout service at three times peak traffic |
| TypeInvestigation or failure report | AnswersWhy did it fail? | What changesA timeline and a root-cause analysis replace a single method section | Sample titleCracked pump housings at Station 2: root cause and repair |
| TypeFeasibility study | AnswersCan we do it, and should we? | What changesOptions, constraints, costs and risks, ending in a go or no-go | Sample titleRooftop solar for the Elm Street depot |
| TypeRecommendation report | AnswersWhich option should we choose? | What changesA table of options scored against agreed criteria | Sample titleChoosing a document system for the legal team |
| TypeProgress report | AnswersWhere does the work stand? | What changesWork done, work remaining, problems and a revised schedule | Sample titleBridge deck survey: progress report 2 of 4 |
| TypeLab report | AnswersWhat did the experiment show? | What changesTheory and procedure up front; closest in shape to a paper | Sample titleSpring constants of three steel springs |
For a workplace injury or a near miss, use the incident report template instead; it is built for a factual record made the same day.
Technical report vs research paper
The two look alike, and the difference is the reader. A research paper is written for other researchers and usually follows IMRaD: introduction, methods, results and discussion. A technical report is written for whoever commissioned the work.
| Feature | Technical report | Research paper |
|---|---|---|
| FeatureWritten for | Technical reportA client, a manager or a sponsor | Research paperOther researchers |
| FeatureOpens with | Technical reportA summary with the recommendation | Research paperAn abstract |
| FeatureEnds with | Technical reportConclusions and recommendations | Research paperDiscussion, limitations and future work |
| FeaturePublished | Technical reportInternally, to a client or in a numbered series | Research paperUsually in a journal or conference proceedings, after peer review |
For an IMRaD paper annotated section by section, see the research paper example.
Tips for a clear technical report
Says what was found
- In the freezer, a full battery lasted a median 4.1 hours, against 11.6 hours at room temperature.
- We recommend buying 30 spare batteries ($1,950).
- 3.2 Warming breaks added 1.5 hours
Says that something was found
- Battery performance was significantly affected by low temperatures.
- Further investigation of mitigation options is recommended.
- 3.2 Condition C
- Put numbers in the summary. “4.1 hours instead of 11.6” lets a reader judge the size of the problem; “significantly shorter” doesn't.
- Give every number its unit. Use one system of units throughout, and record your choices for numbers, units and abbreviations in a style guide if several people write reports.
- Name your limits. Say what could make the results wrong, in which direction, and what the work can't establish, before a reviewer has to ask.
- Make long reports skimmable. Headings that state a finding, like the one above, let a reader follow the argument from the contents page alone.
“Use this template” opens the report in Strokes with the numbered sections and the title-page table in place; page view shows it as it will print, and export to PDF or Word gives you the version to send. When the draft is done, ask the Strokes Assistant to review it for numbers in the summary that don't match the results, and for recommendations no conclusion supports.
Frequently asked questions
Should a technical report use “we” or the passive voice?
Both are in use, and conventions differ by field, organization and course. Many workplace reports use “we” for what the team did and decided, as the scanner report does, and keep the passive for steps where the actor doesn't matter. If your course or organization has a style guide, it decides; otherwise pick one approach and keep it throughout the report.
How long should a technical report be?
There is no standard length. Course assignments usually set a page or word limit. At work, keep the body as short as the reader's decision allows and move raw data, calculations and long procedures to appendices. Keep the summary to about half a page, however long the report is.
Does a technical report need an executive summary or an abstract?
Most need one or the other. Use a summary, often called an executive summary, when the reader must decide something: it states the findings and the recommendation. Use an abstract when the report goes into a research series or a database, where readers decide whether to read it. Some reports have both.